
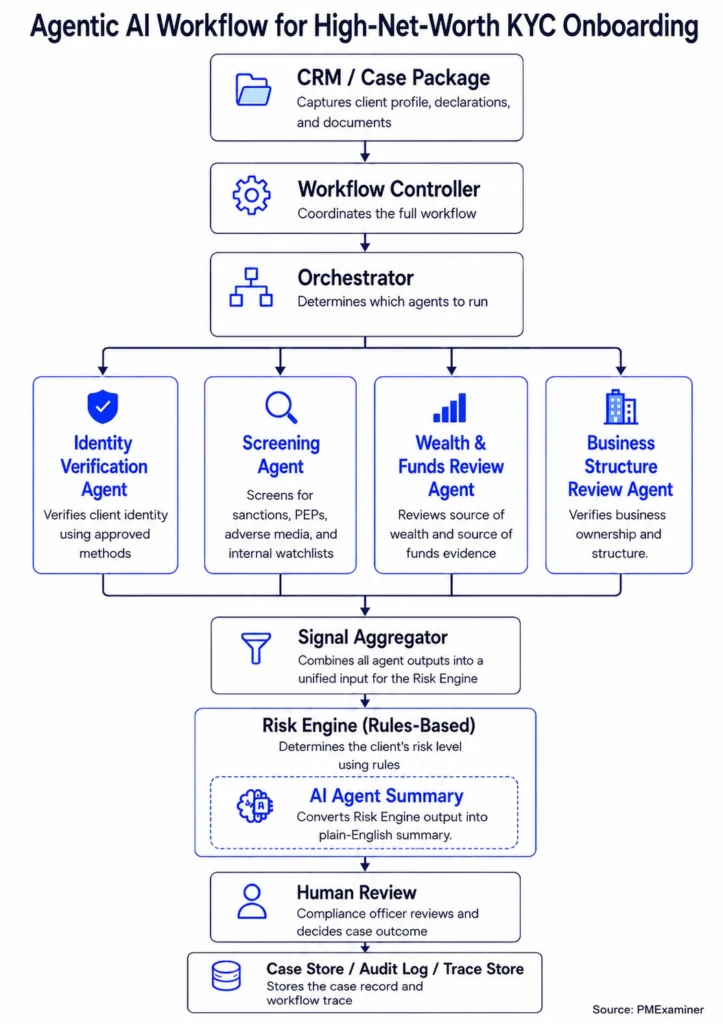
In this series, we are building an agentic KYC workflow for high-net-worth onboarding piece by piece.
- The full agentic KYC workflow and architecture
- The CRM and Case Package layer
- The Workflow Controller
- The KYC Orchestrator
- The Identity Verification Agent
- The Screening Agent
- The Wealth And Funds Review Agent
- The Signal Aggregator
- The Risk Engine
- The case store (this post)
I also built a working prototype in Python to demonstrate this architecture. You can find the link to the prototype here.
By this point, the agents have reviewed James’s profile, and the Risk Engine has sent its output to the compliance officer.
That output helps the compliance officer see the case clearly. It shows what the workflow has already reviewed and what still needs human review.
For James, the workflow has already verified his identity. The Screening Agent found no sanctions match, no adverse media concern, and no internal watchlist match. The Business Structure Review Agent also supported the planned $4 million transfer from his business sale.
But the case is not complete yet.
Three areas still need attention. James has a possible PEP status. The bank could not establish how he acquired his crypto funds. James also expects cross-border transactions.
That gives the compliance officer a clear starting point.
They do not need to review James’s whole case from scratch. The workflow has already verified James’s identity, checked the screening results, and reviewed the business sale.
Now the compliance officer knows exactly where to focus: James’s possible PEP status, his crypto source of funds, and his expected cross-border transactions.
Those details help the compliance officer decide whether the bank should take James on as a client.
This is how the agentic workflow saves time for the compliance officer. It separates what the workflow has already reviewed from what the compliance officer still needs to review.
Now the question is what the workflow stores after it runs.
The workflow stores two types of data.
The first is the workflow trace.
The workflow trace shows how the agentic workflow ran.
It is mainly useful for debugging. It helps the bank see whether the workflow ran properly, whether the right agents were selected, and whether any step failed or paused.
For James, the trace would show that his case entered the workflow and that the Orchestrator created a plan. It would also show that the Orchestrator selected the Identity Verification Agent, the Screening Agent, the Business Structure Review Agent, and the Wealth and Funds Review Agent.
The trace would also show what an agent received and which tools it used.
For example, the Wealth and Funds Review Agent received the crypto exchange statement and the planned crypto funding amount. It then reviewed the exchange account and used a crypto transaction screening tool.
This kind of detail helps the team debug the workflow.
If the Wealth and Funds Review Agent keeps returning unclear findings, the team can use the trace to investigate what went wrong.
They can ask simple debugging questions.
- Did the agent receive the right input?
- Was the crypto exchange statement missing?
- Did the crypto screening tool fail?
- Did the agent return the finding in the wrong format?
The workflow trace helps the team answer these questions without guessing.
But the workflow trace only tells half the story. The bank also needs to explain why a particular decision was made on James’s case.
That is where the case record comes in.
The case record stores the information the bank needs to explain James’s KYC review later to a regulator.
It stores three things.
First, it stores what James declared.
James declared a business sale as his source of wealth. He planned to transfer $4 million from the business sale proceeds and $1 million from crypto funds. His profile also included possible PEP status and expected cross-border transactions.
Second, it stores what the workflow found.
James’s identity was verified. Screening found no sanctions match, no adverse media concern, and no internal watchlist match. The business sale review supported the planned $4 million transfer. The wealth and funds review showed that James had enough funds in his crypto exchange account, but the bank still had not established how he acquired those crypto funds.
Third, it stores the decisions made on the case.
The Risk Engine marked James’s case as high risk and routed it to enhanced review. It pointed the compliance officer to three areas: possible PEP status, the source of crypto funds, and expected cross-border transactions.
The compliance officer then asked for more information. James needed to provide records showing how he acquired the crypto funds. The business sale funding was supported, but the source of the crypto funds still needed review.
That is what the case record is built for.
If a regulator asks why James was approved or rejected, the bank can point to the case record and show exactly how the decision was made.
Where does all this data get stored?
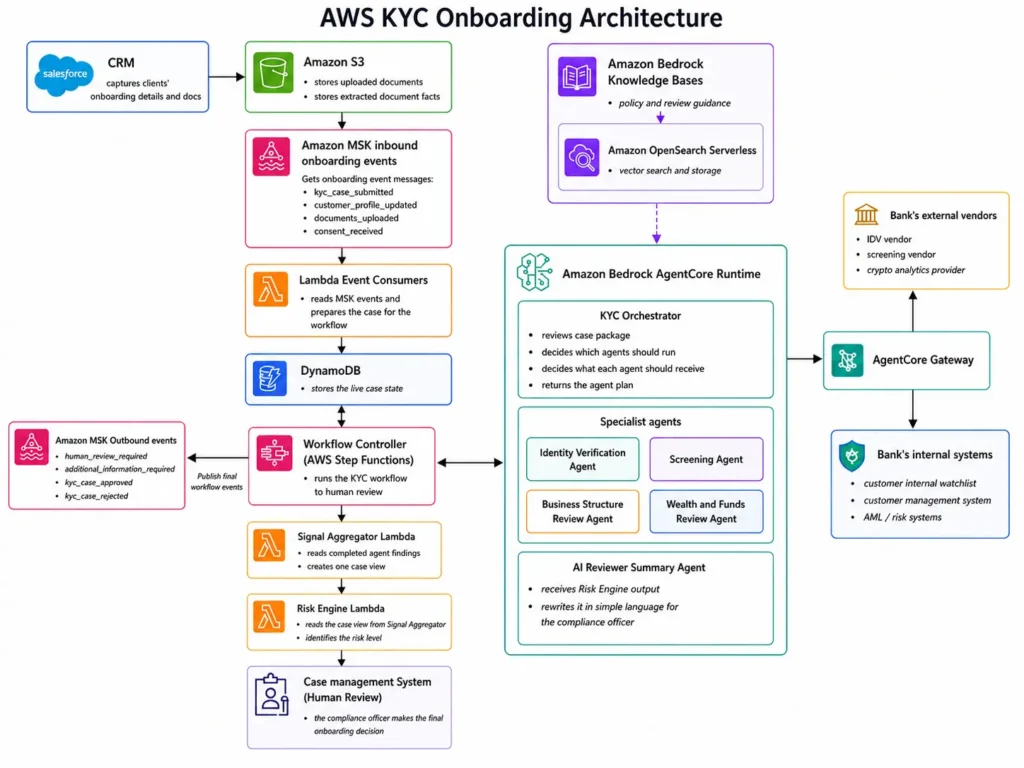
To make this easier to understand, let’s use the AWS version of this workflow as an example.
I covered the full AWS architecture in my AWS KYC workflow post. But here, we only need to focus on one thing: where the data gets stored after the Risk Engine gives its output.
In a real bank, this data usually does not sit in one system. Documents, case status, workflow logs, agent outputs, and final decisions often live in different places.
In the AWS version of this workflow, the data is spread across four systems.
Amazon S3 stores the documents James uploaded during onboarding. His business sale agreement, bank statements, and crypto exchange statement all sit here, along with any facts extracted from those documents.
Amazon DynamoDB stores the live case state while the workflow runs. As each agent completes its review, DynamoDB holds the latest case status, agent findings, Risk Engine outcome, and AI Reviewer Summary.
AWS Step Functions records how the workflow moved from one step to the next. It shows when each agent ran, whether a step failed, and whether the workflow paused at any point.
CloudWatch logs capture the technical details from each step. If something goes wrong, the team can use these logs to find where the workflow broke down.
The final case record goes into the bank’s case management and audit systems. This is where the compliance officer’s decision lives. It captures the reason for the decision, the date it was made, and who made it.
So the bank does not rely on one database to understand the whole case.
It looks across these systems to answer two different questions.
- How did the agentic workflow run?
- And why was this decision made for James’s case?
Here is what we covered.
The workflow stores two types of data: the workflow trace and the case record.
The workflow trace shows how the agentic workflow ran. The case record shows why the final decision was made on James’s case. Together, they give the bank what it needs to check whether the workflow ran properly and explain the decision to a regulator. Not just in a demo. But in production.