
Your feature has now been launched to all one million high-net-worth clients.
But how do you know whether it solved the problem you set out to solve?
You collected feedback from users during the pilot phase, and that confirmed the feature worked and that clients could use it.
However, pilot testing involves only a small number of users.
To determine whether the feature actually solved the problem, you need to see how many more high-net-worth clients use the feature after launch.
You do this in two ways. You measure the metrics that were defined earlier, and you track the Customer Effort Score.
Together, these signals show whether the feature solved the problem that was causing churn.
Give users time to use the feature before measuring the metrics
You cannot measure the impact of a feature immediately after launch because clients need time to discover the feature and start using it.
You usually wait about thirty days after launch before measuring the first set of results. This gives enough time for clients to start using the feature and for you to collect enough usage data to see meaningful patterns.
After that, you measure the same metrics again at sixty days and ninety days.
Tracking the metrics at 30, 60, and 90 days shows whether clients continue to use the feature and whether the improvements last over time.
Comparing the metrics before and after launch
The simplest way to understand whether the feature worked is to compare how clients contacted their RMs before the feature existed and how they contact them after it launched.
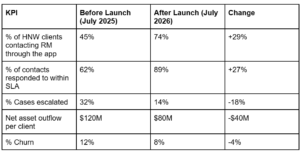
For example, if the feature went live on June 1, 2026, you measure the metrics on July 1, 2026, and compare them to the same period one year earlier on July 1, 2025.
Before the feature existed, clients contacted their relationship managers through other channels, such as direct phone calls or emails outside the app.
The table above compares the same KPIs before and after the feature launched.
After launch, more clients reached their relationship managers through the app, more requests were handled within the expected SLAs, and fewer cases required escalation. Net asset outflow per client began to decline, and as a consequence, churn also declined.
These changes show that the feature has reduced the friction that previously prevented clients from reaching their relationship managers.
Apply segmentation to the metrics
Looking at the metrics for all high-net-worth clients is not enough. You also need to know how these metrics change for your other major segments.
Earlier in the series, you identified that traveling retired business owners were churning more than other segments. You need to see whether the feature is solving the problem for this segment. You also need to see how the feature impacted your major client segments like retired business owners and passive heirs, who account for the majority of your clients.
You analyze the data across all your major client segments:
- All high-net-worth clients.
- Retired business owners (domestic).
- Retired business owners (traveling).
- Passive heirs (domestic).
- Passive heirs (traveling).
For example, the overall metrics might show great improvements across the entire client base. But when you examine the metrics for traveling retired business owners, you might discover that their escalation rates are still high or that their requests are still taking longer to resolve. If that happens, the original problem still exists for that segment.
Segment-level analysis helps you see if the feature is working for all segments or if traveling retired business owners are still experiencing the same friction that was causing them to churn. If their metrics haven’t improved, you know where to focus additional improvements.
Measuring satisfaction using Customer Effort Score
The metrics show how clients used the feature, but they don’t show how easy it was for clients to use it.
To measure that, you track the Customer Effort Score.
Customer Effort Score measures how easy it was for a client to complete a task. In this case, the task is reaching their relationship manager when they need help.
You measure CES with a single question:
“How easy was it to reach your relationship manager using this feature?”
Clients respond using a five-point scale.
| Score | Scale |
| 1 | Very difficult |
| 2 | Difficult |
| 3 | Neutral |
| 4 | Easy |
| 5 | Very easy |
If most responses fall in 4 or 5, the feature is reducing friction. If responses cluster around 2 or 3, the experience still needs improvement.
To ensure meaningful responses, you measure CES only for users who have used the feature at least twice.
Just like the metrics, CES should also be analyzed by segment. This means you review CES scores for:
- all high net worth clients
- retired business owners (domestic)
- retired business owners (traveling)
- passive heirs (domestic)
- passive heirs (traveling)
Now the question is: how do you collect CES responses from one million clients?
Collecting CES responses at scale
Since one million high-net-worth clients use the feature, feedback must be collected at scale.
You do this through an in-app survey that appears after a client has used the feature. For example, after a client contacts their relationship manager through the app two or more times, the app displays the Customer Effort Score question.
Survey software makes this easier. It lets you collect responses directly inside the mobile app, calculate CES scores automatically, and analyze results across different client segments.
You collect enough responses from each segment to understand how that group feels about the feature. For example, you might collect 3,600 responses from retired business owners and 2,500 from passive heirs.
If CES scores are high across all segments, it indicates that clients find the feature easy to use regardless of their profile or travel status.
Did the feature solve the problem?
When these metrics improve together, the answer becomes clear.
More clients are reaching their RMs through the app. The bank is handling more requests within SLA, fewer cases are escalating, asset outflows are stabilizing, and churn is declining.
This shows that the feature is solving the problem that caused clients to leave in the first place.
This is the final piece of the fintech puzzle.
The work started with identifying which clients were churning and why. Client interviews uncovered the root cause. The solution was designed within real technology and compliance constraints, built with multiple engineering teams, and verified using real client data.
When all five pieces come together in the right order, the result isn’t just a new feature. It’s a solution to a real customer problem, and that’s what drives growth in high-net-worth banking.